Quick Answer
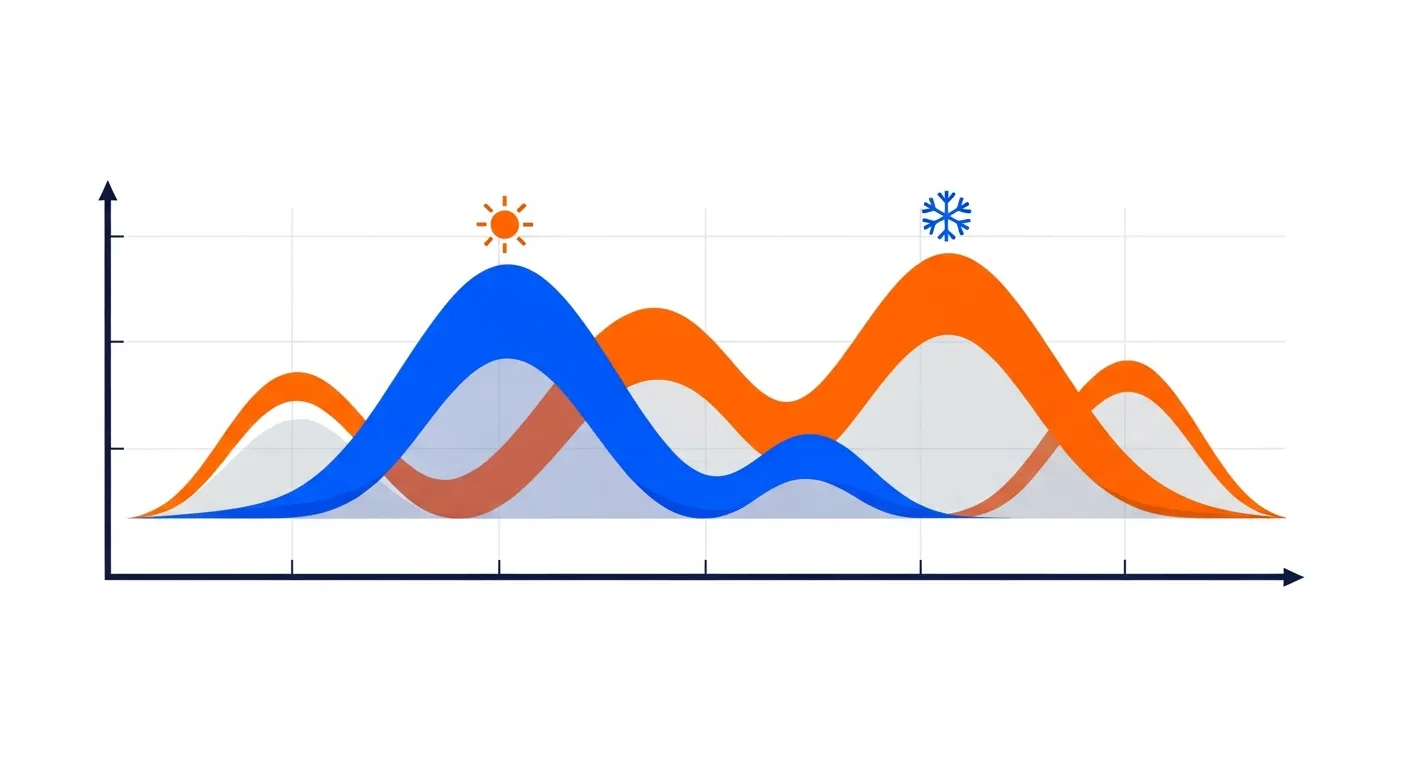
HVAC search demand swings 250 to 600 percent between peak and trough, the sharpest seasonality of any home service. AC repair searches spike 266 percent in July heatwaves, furnace repair peaks 137 percent in January cold snaps. Because SEO takes 3 to 6 months to move rankings, the contractors who win each surge did the work a season earlier. Plant in the shoulder season, harvest in the peak.
The short version: HVAC has the sharpest seasonal search swings of any home service, with variance of 250 to 600 percent between peak and trough. And the contractors who win the summer surge are the ones who did the work in spring.
Want to know what the next surge looks like in your market? A free audit models your search volume, your current grid coverage, and the seasonal curve for your city.
Get a Free AuditThe Seasonality Data
| Search demand | Peak | Swing | Trigger |
|---|---|---|---|
| AC repair | July | +266% during heatwaves | Sustained temps above ~85°F |
| Emergency AC repair | Summer | up to +400% from winter baseline | First real heatwave of the year |
| Furnace repair | January | +137% during cold snaps | Sustained temps below ~45°F |
| Heating system repair | October to January | +594% variance | First cold weekend |
| HVAC replacement / installation | Late spring and early fall | Steadier, quote-driven | System failures in the prior peak |
The seasonal swing figures above draw on WebFX seasonal home services search data. Two things stand out.
First, demand is weather-triggered, not calendar-triggered. The spike does not wait for July 1st. It arrives with the first 90-degree week, wherever that falls. Google sees the surge within hours.
Second, replacement demand trails repair demand. A brutal July creates a wave of ageing systems that limp through to a replacement decision in September. The $7,500 to $14,000 jobs are downstream of the $400 repair searches.
The Mistake: Buying Visibility at Peak Prices
When the July surge hits, every contractor in your market reaches for the same lever at the same time: ads. Cost per click rises with demand, and the contractors who are only visible when they pay are buying their most expensive clicks of the year at exactly the moment lead quality peaks.
Meanwhile, the Map Pack, which takes 33 to 44 percent of all local clicks, does not reprice. The three contractors sitting there in July earned those spots in March. They take the surge for free.
The Investment Calendar That Matches the Demand Curve
SEO takes 3 to 6 months to move rankings, which means the work has to start a season ahead of the demand it captures. Here is the calendar we run campaigns against:
| When | What to do | What it captures |
|---|---|---|
| January to March | Cooling content and service pages, AC-related GBP posts and categories, review velocity push | The June-August AC surge |
| March to April | Technical fixes live, citations complete, cooling keywords climbing | First-heatwave emergency searches |
| June to August | Harvest season. Convert calls, gather summer reviews, publish replacement-intent content | September replacement wave |
| September to October | Heating content and pages, furnace keywords, winter GBP refresh | The December-February furnace surge |
| November to December | Harvest again. Reviews, case studies, next year's planning | January emergency peaks |
The pattern is simple: plant in the shoulder season, harvest in the peak. The quiet months your competitors treat as dead time are the highest-value marketing months of the year.
This is also why "we will start SEO when things pick up" is backwards. Starting SEO in July captures the winter furnace season at the earliest. Starting in March captures both. Our local SEO campaigns are sequenced around this calendar from day one.
What to Do in Each Shoulder Season
Spring (the AC pre-season)
- Publish or refresh AC service pages and city pages before demand arrives. One page per service, per city, as covered in our local SEO guide.
- Update your Google Business Profile: cooling services front and center, summer photos, AC-related Q&A.
- Push reviews hard. Review recency is one of the most underrated ranking factors, and 74 percent of consumers specifically look for reviews written in the last three months, per the BrightLocal local consumer review survey. Reviews gathered in April are ranking fuel in July. Our review generation guide covers the system.
Fall (the furnace pre-season)
Same playbook, heating flavor: furnace and heat pump pages, heating keywords, winter-ready GBP, and a review push off the summer's job volume, which is your biggest review opportunity of the year.
Seasonality Is Also a Forecasting Tool
Because demand is this predictable, your pipeline is forecastable. If you know your Map Pack coverage, the monthly search volume for your core terms, and the seasonal multiplier, you can estimate call volume a season ahead, which makes hiring and van decisions less of a gamble.
That is exactly the model we build in every free audit: your market's search volume, your current grid coverage, and what the seasonal curve means for your specific city. Try the quick version yourself with our Map Pack Calculator.
Frequently Asked Questions
When is the best time to start SEO for an HVAC company?
How much does HVAC search demand actually change between seasons?
Should I cut marketing spend in the slow season?
Do replacement jobs follow the same seasonal pattern as repairs?
How does weather affect local search rankings?
Get Ranked Before the Next Surge
A free audit models your market's search volume, your current grid coverage, and what the seasonal curve means for your city. No obligation.
Local SEO Sequenced to Your Season
We build the rankings that capture each surge in the shoulder season before it arrives, so you own the Map Pack when demand peaks.
Related Articles
The Complete Local SEO Guide for HVAC
One page per service, per city, and the content engine behind every campaign we run.
Google Business Profile Optimization for HVAC
Categories, posts, photos and Q&A: how to keep the biggest local ranking factor working all year.
The 5-Star Review System for HVAC Businesses
The exact same-day process that turns completed jobs into the review recency that fuels rankings.
HVAC Cost Per Lead: What the Data Actually Says
Why peak-season ad clicks cost the most and how SEO leads get cheaper over time.
HVAC SEO Pricing: What Contractors Actually Pay
The three-tier structure, what each plan includes, and how the compounding pays off fastest when you start early.
PPC vs SEO for HVAC Contractors
Paid ads rent your lead flow at rising rates, SEO builds an asset. The full comparison with data.